

Are all profits equal?
“£1 of profit is £1 of profit, and I’ll take it wherever it comes from.”
True?
Well, maybe.
£1 of profit from an activity at busy times could stop you from earning £5 on another if you could put resources on that instead.
At slower times, a £1 profit could stop you losing £5 from having people otherwise doing nothing.
Could profits have been £2 if you intervened at the point when things started to be less efficient, but no-one noticed as the job was still profitable?
A £1 loss could be £10 profit in the future, if the new client you are working for is so impressed they reorder bigger.
So, it all depends on the context.
What the British cycling team can teach us
Many small business owners will say that they have a feel for which projects or customers are profitable – “we are just fine thanks, our bottom line goes up all the time”.
And in most cases that will be true. But that will be based on the total bottom line. Could it have gone up even more if you had more ability to monitor its component parts?
There is a concept called ‘the aggregation of marginal gains’. No, don’t switch off; this is not just an accountant thing. It’s the method that performance director Dave Brailsford used to turn the British cycling team from no-hopers to world-beaters.
The concept is simply that if you break everything down and then figure out how to improve individual components by 1%, you will get a significant increase over time as the 1%’s add up and keep repeating.
Project profit
Consider, for example, the following graph. It shows the count of projects in the last year across the bottom. Then going upwards, the cumulative profits and losses of each project as a % of the total earnings for the year. Profit = time at cost rates plus materials.
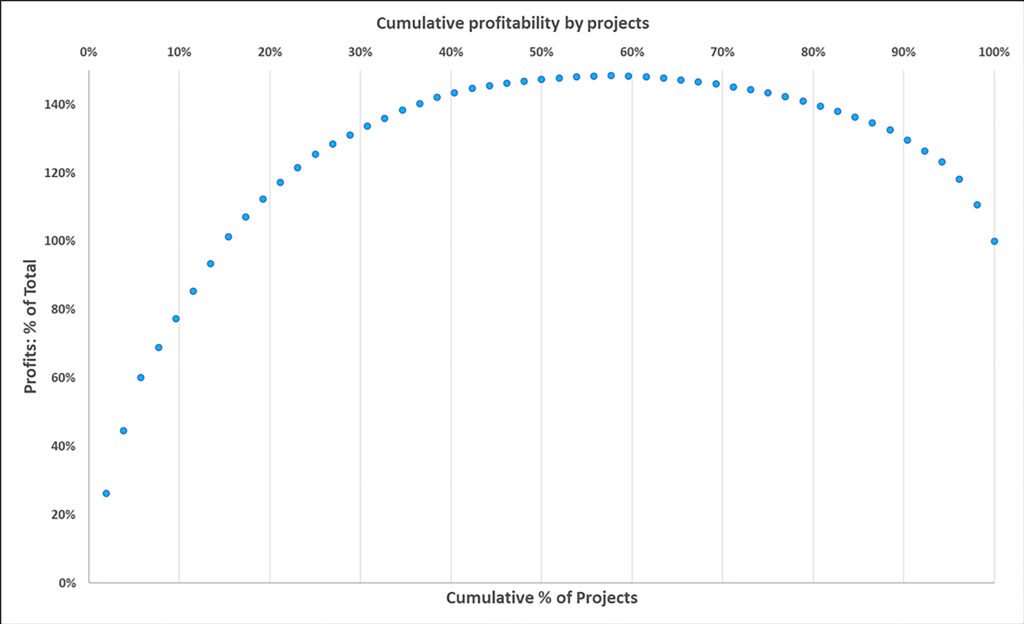
The graph shows that 40% of projects make most of the money. The following 30% of projects are just above break-even. If you could somehow stop there at just profitable projects, then earnings would have been 148% of what they were. But it’s the final 30% projects that are loss-making and which drags profits back down again.
It’s tempting to say that profits could have been at least 48% higher than they were. But In reality, some losses could be because you could not foresee at quote stage what would happen. Others were due to working on ‘strategic accounts’ in anticipation of future orders. Nevertheless, I bet that a timely intervention could have recovered a decent chunk of that 48% profits reduction. And drilling down further into why 40% of projects were so profitable, can yield lessons learned to apply to others.
Customer profitability
The same holds for services, such as those of an IT Managed Service Provider. Calculate a cost for each activity your teams conduct, then track the hours or number of each service recurrence across all clients. Profit is the retainer fee your customer pays you plus extras, and minus the activity costs.
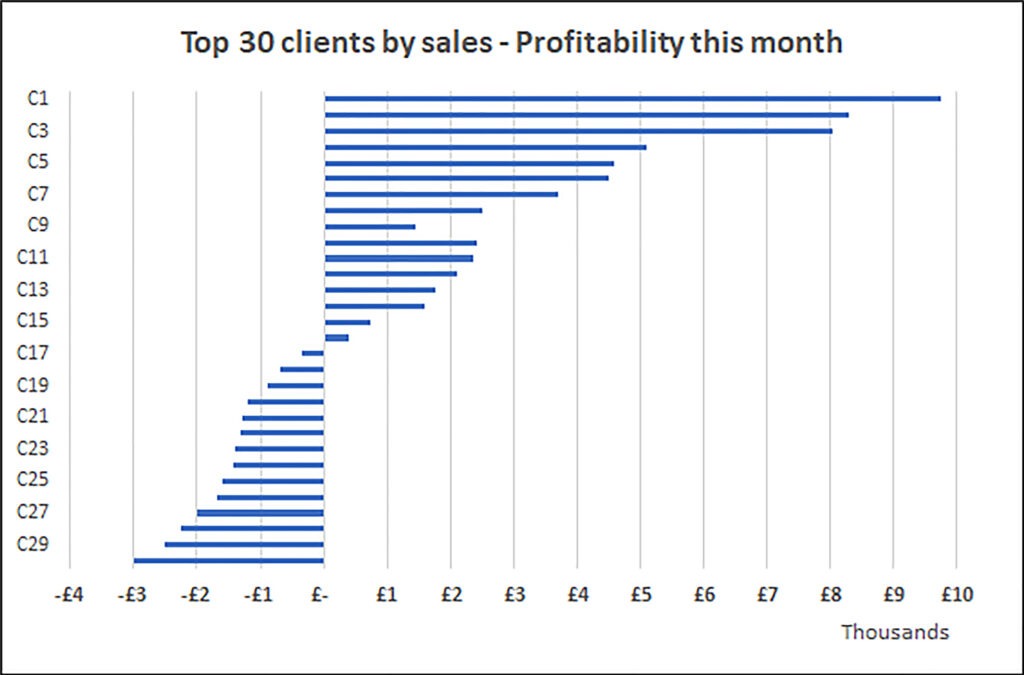
You can drill into each loss-making customer to see what is causing that.
Are they consuming an exceptionally high amount of one activity, and they can be educated not to do it so much, or the cause be rectified by some capital spend?
Do the figures quantify how much of a ‘vampire client’ they are – they suck up a batch of your resources, always want more but vehemently resist any fee increases?
Is it a reasonable client who perhaps has grown incrementally over time without you altogether noticing – and is receptive to a fee increase?
Or do the figures highlight that you have one or more loss-making activities. You need to either make them more efficient internally or take them off the menu altogether.
Track your profit component parts and watch your bottom line grow!
For both project costing and activity-based costing for services, your cost rates and tracking systems will require some initial setting up then tweaking as the first results come in.
But in our experience, this initial investment will always pay off many times over in terms of increased profits. The results are often also quite an eye-opener to boot – you see the numbers on how profitable or loss-making specific projects and customers are!
Please speak to us for a free initial review on how we can drill down together into your profitability.